Power BI - New Feature Highlight - Performance Indicators and Ratings for Business
Ratings visual by TME AG
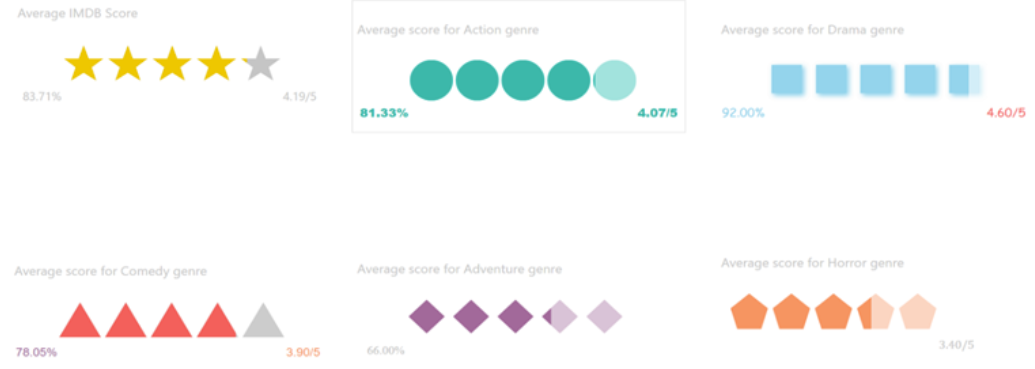
This new visual provides a variety of rating options for various performance indicators.
Features
6 styles of progress indicators
Shows progress as a % of total indicator style i.e. 80% = 4/5 stars
Number of indicators can be chosen for customisation purposes
Different colour schemes for on-brand displays
Other custom features including displaying or hiding labels, heading position, vertical vs horizontal display
Overview
This a great addition to the Power BI solution as could be a very useful tool for almost every business.
This rating visual allows the use of different indicator styles to that can be used to represent completeness, progress, performance or whatever other percentage metric you'd like to incorporate.
Why we think you might find it useful
Visual displays of progress are a great way to quickly update teams on the progress of certain aspects of your business, including promotions, the role out of a project, hitting a sales target or even completing a series of mandatory online courses.
The simple display can simplify the complexity of data for users who need quick insight into where things are at and how much more needs to be done, without inundating with overly unnecessary data.
This post is a featured article of White Box’s ‘Learning’ page. To learn more about the beauty of data and its applications, you can explore all of our learning posts here.
If you’d like help with understanding how best to use your data, then please get in touch.