


Combining Covid & Google Data with Snowflake, Power BI, Excel and Google

How can we measure the effectiveness of government lock-down restrictions across the globe in reducing outbreaks of the Covid-19 pandemic. We discover the effectiveness of individual nations’ lockdown restriction success by comparing global mobility trends with Covid-19 case numbers, utilising tools including Snowflake, Power BI and Excel which should be staples in any modern businesses data analysis.

Read More
COVID trend analysis

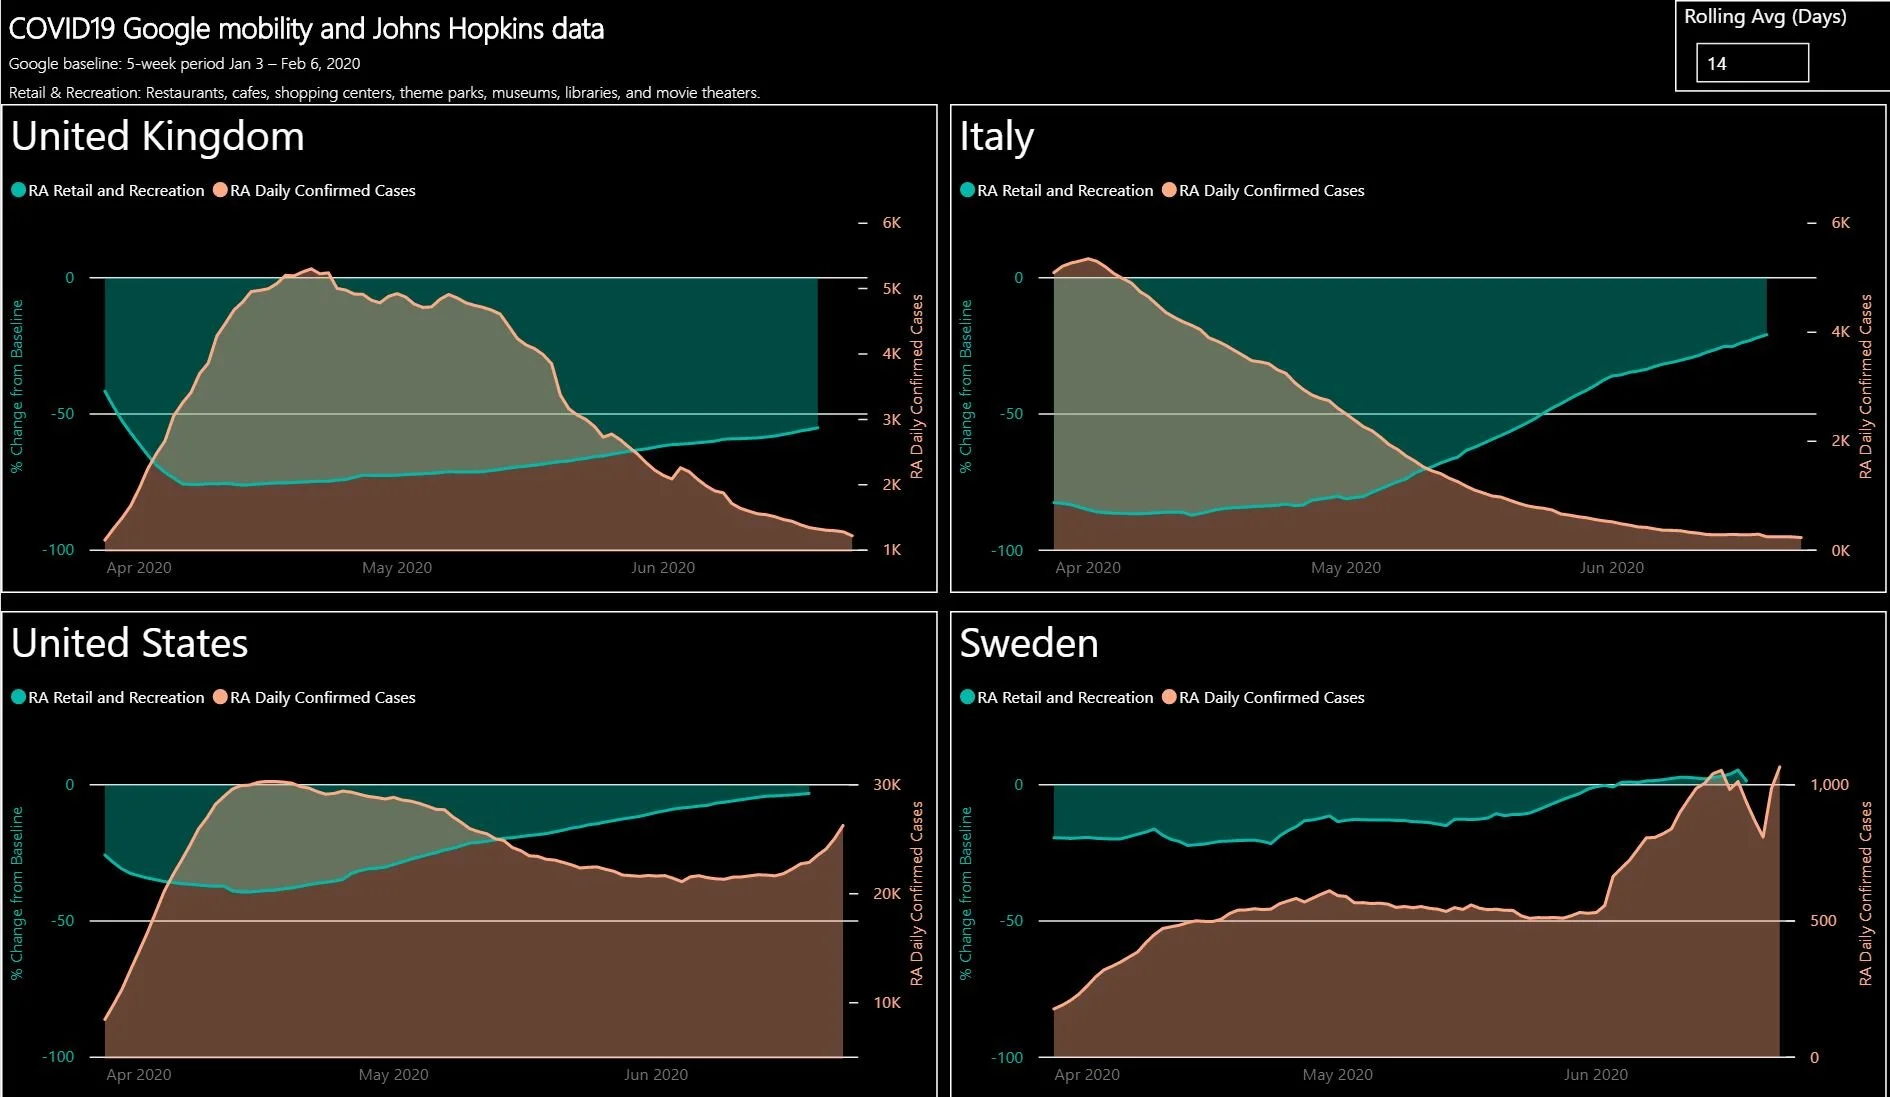
Lock-down measures were a theoretical strategy to contain and flatten the curve and to all extents, they “feel” like they’re working but can we prove it using data?

We have been analysing COVID country data since February and have now combined Google’s mobility data to give us a holistic view of emerging trends.

Read More
Choosing a second hand car - Decomposition Tree Analysis | Power BI | Visualise

Using Power BI's decomposition tree visual, we analyse second hand cars dating back to 1990 so you can find the perfect vehicle for you. The analysis aggregates multiple dimensions of data, taking you on a path based on your ideal criteria; a process that can also be used widely in marketing and business for root cause analysis.

Read More