

A Power BI visualisation showcasing how grocery product purchase trends have been influenced by coronavirus in the UK.
Read More
At White Box, we’re passionate about data analysis & visualisation and we like to showcase this through our Data Stories.
Our blog posts cover diverse topics but all have data analysis and visualisation as the backbone to the thoughts and insights we uncover.
A common misconception is that businesses need perfectly organised, enterprise-grade data before they can benefit from AI. While strong data foundations certainly improve outcomes, perfection isn't the goal.
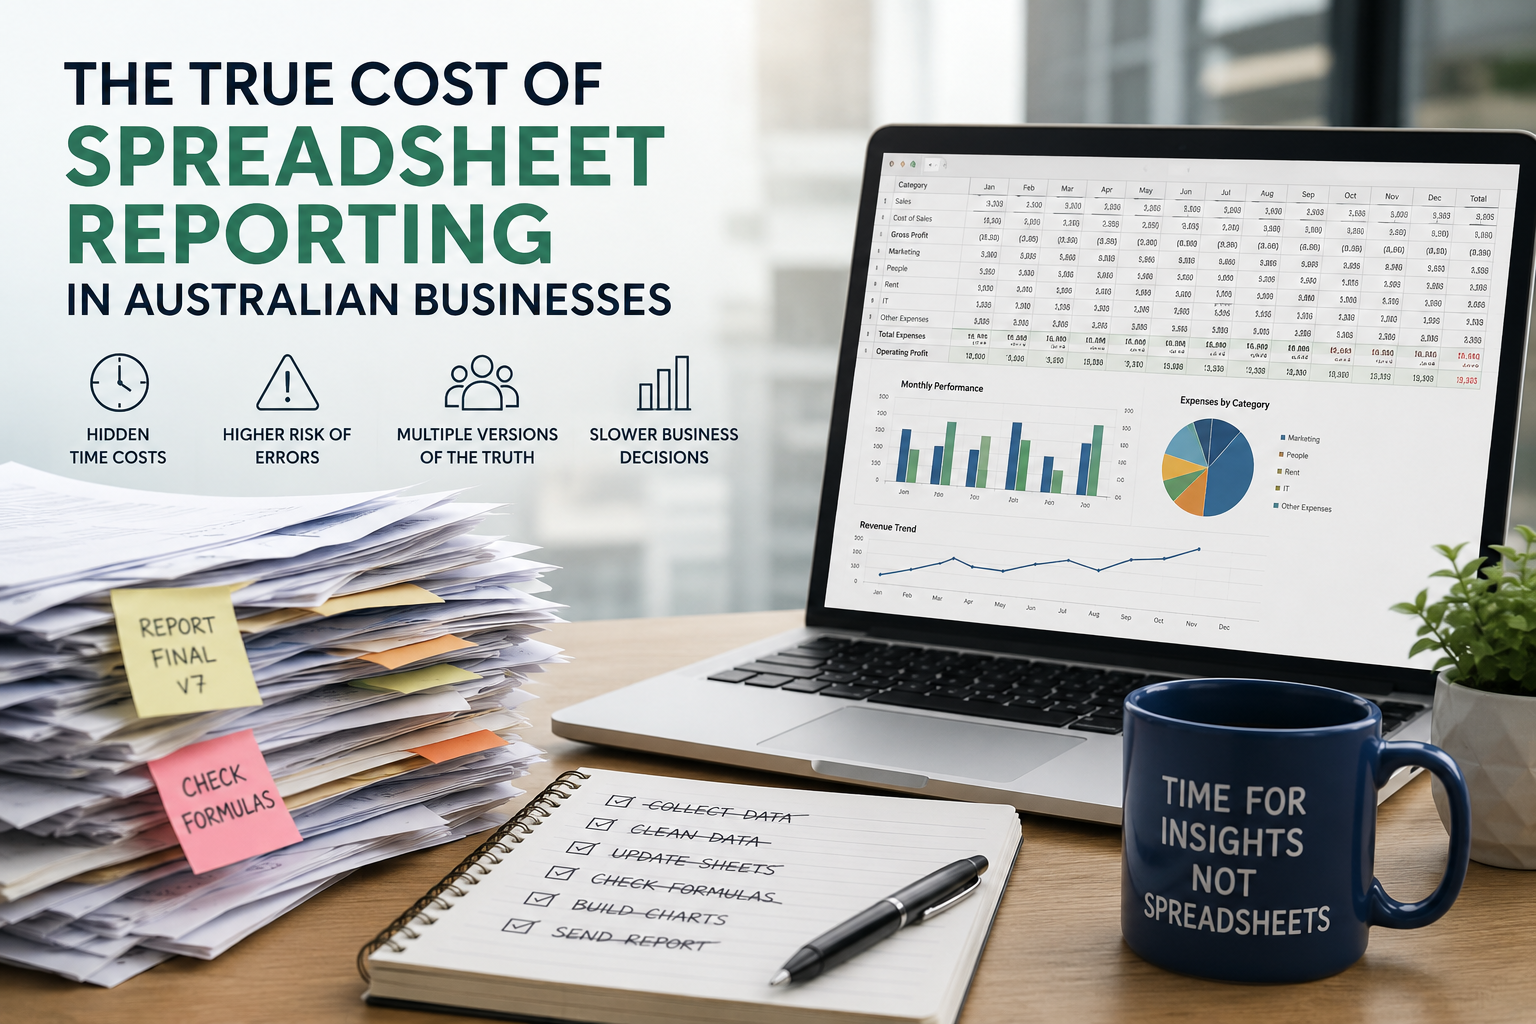
As businesses grow, spreadsheet reporting often becomes an expensive bottleneck that consumes valuable time, increases business risk and limits the ability to make informed decisions.
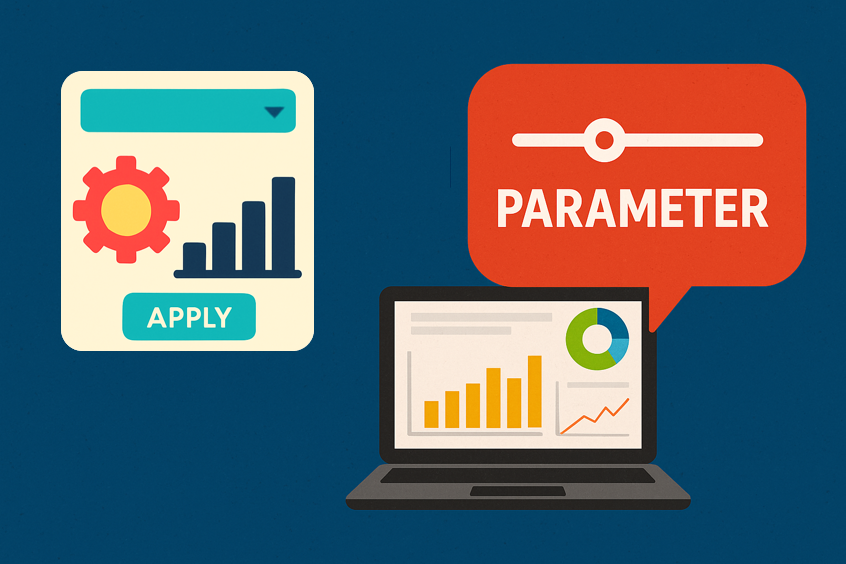
Learn how to use Power BI parameters to build dynamic, user-friendly dashboards. This guide covers Power Query, field, and what if parameters with practical use cases.
Power BI and Tableau are two of the most popular business intelligence tools, but which one suits your business best? We compare their usability, visualisation, data integration, report sharing, and pricing to help you make an informed choice.
Data storytelling is the art of translating raw data into a meaningful message, helping teams align, make decisions faster, and communicate insights more persuasively.
Compare AWS, Azure, and Google Cloud to find out which cloud platform offers the best tools, performance, and value for your analytics strategy.
Struggling with slow, cluttered, or confusing Power BI dashboards? Discover 10 common mistakes businesses make in Power BI—and how to avoid them to build faster, clearer, and more impactful reports.
Learn when to use Power BI Paginated Reports versus Standard Reports to deliver insights in the right format for your business needs.
Look back through our old articles using the search function. Key terms to use are “Power BI”, “Tableau”, “Qlik”, “dashboard” and “Visualisation”.
A Power BI visualisation showcasing how grocery product purchase trends have been influenced by coronavirus in the UK.
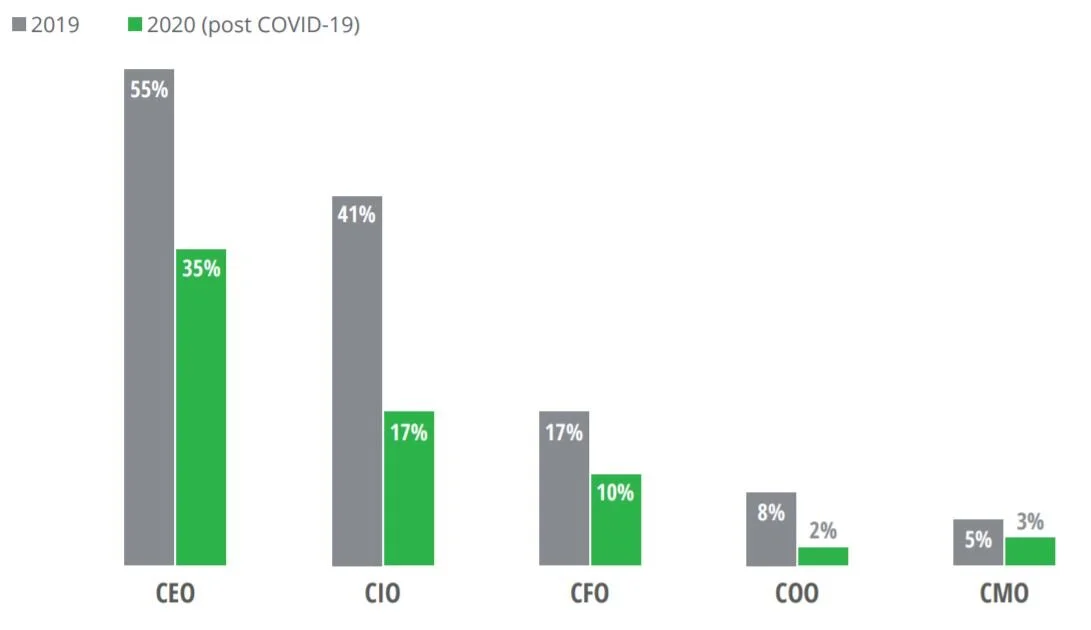
Read MoreInsights from chief executives in global companies confirms the importance of efficiency and productivity, but highlights that better systems are needed by all business to ensure these focus points don’t disenfranchise and isolate customers from the business and force them to competitors.
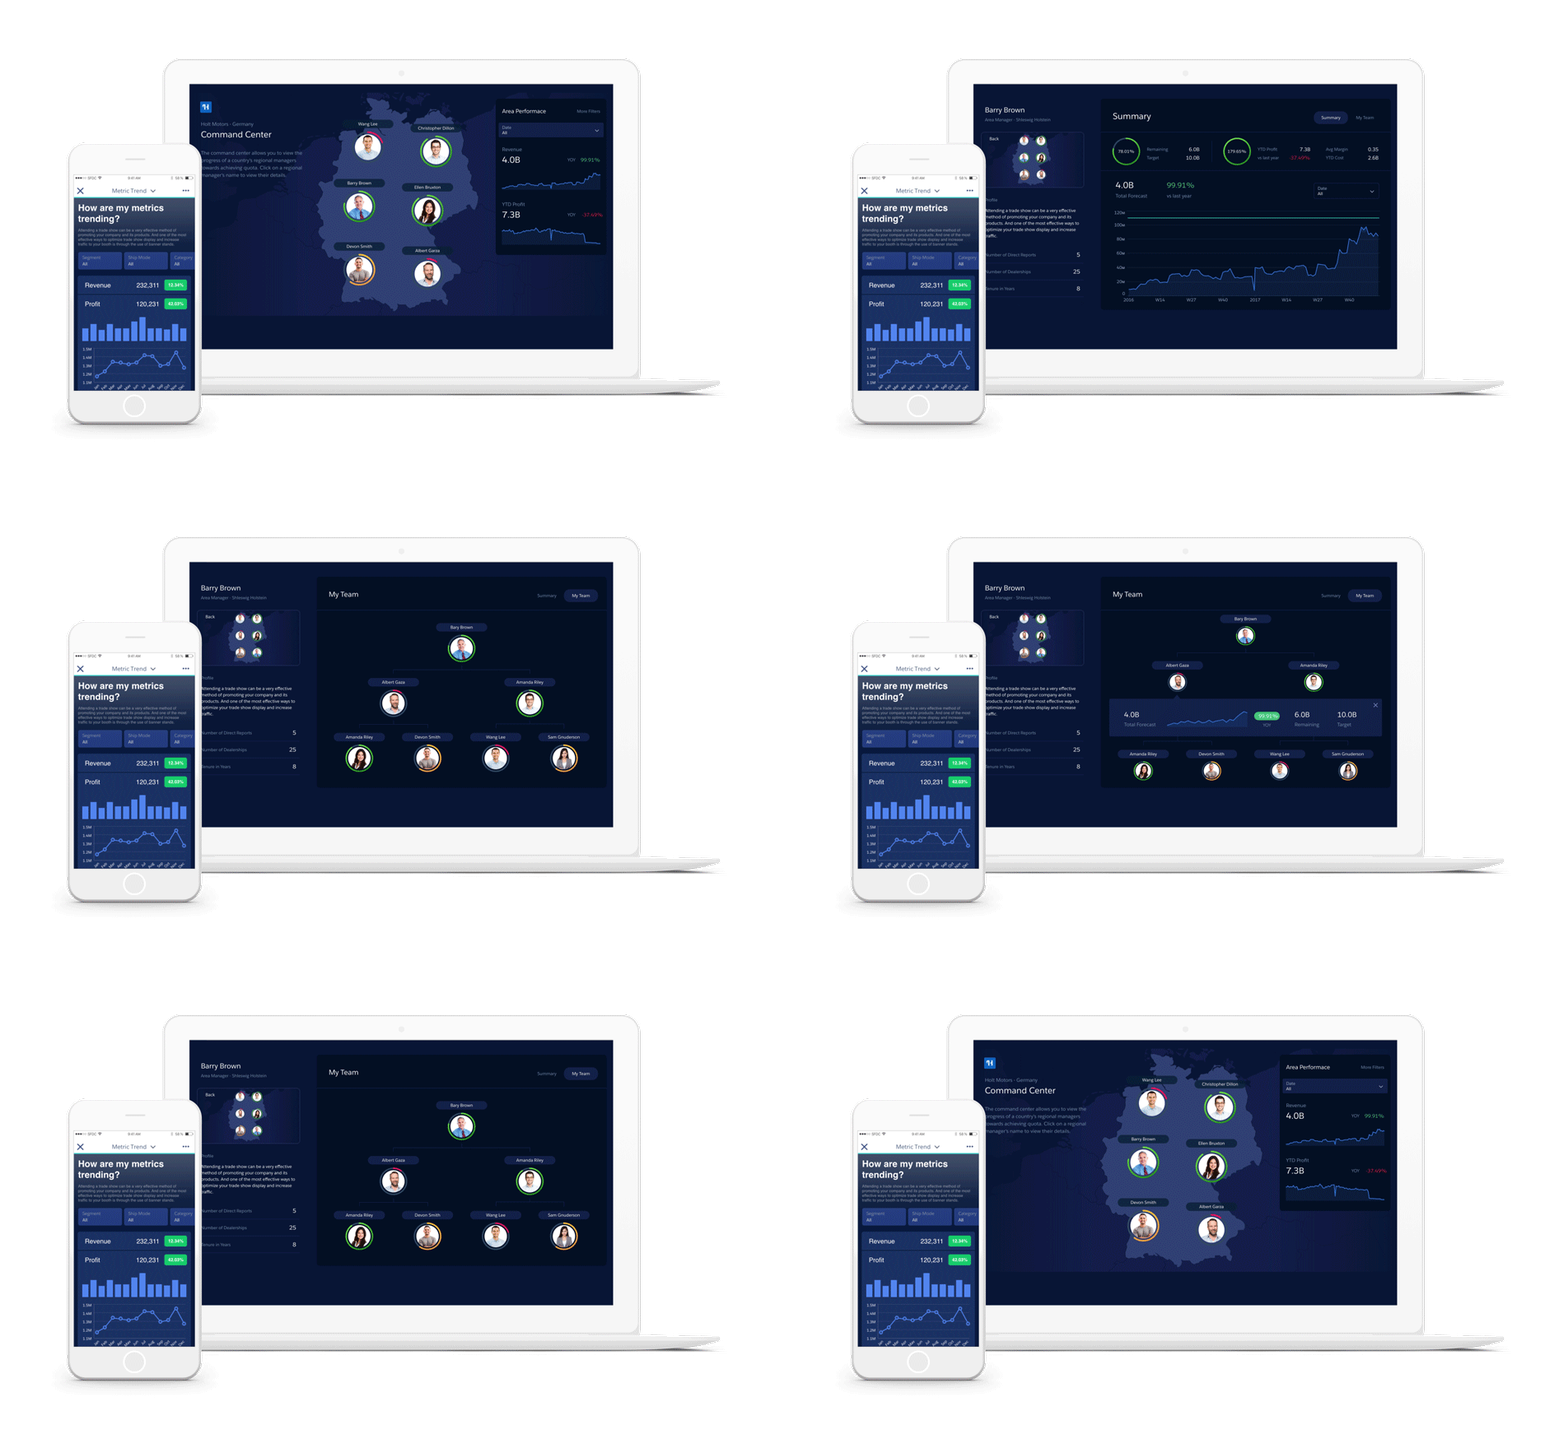
Read MoreThis article discusses Tableau’s new CRM and it’s native integrations with Salesforce and Einstein Analytics. It focuses on the plausibility of whether these technologies make sense for all businesses based on how they were built and function together.
Read MoreThis update aims to alleviate the problem of multiple reports in different locations being used by many individuals, so you as a user know which report is the right one, so you are 100% confidence the data you are using to inform decisions is the most up-to-date and relevant.
Read More