




Power BI offers advanced features that can unlock new levels of analysis and interactivity; here are five powerful but often overlooked capabilities.
Read More
At White Box, we’re passionate about data analysis & visualisation and we like to showcase this through our Data Stories.
Our blog posts cover diverse topics but all have data analysis and visualisation as the backbone to the thoughts and insights we uncover.
Choosing the right business intelligence tool can make a significant difference to how effectively your business uses data. In this guide, we compare Power BI, Tableau and Looker Studio to help you determine which business intelligence solution best suits your needs.
Excel is one of the most useful business tools ever created. It is familiar, flexible and capable of handling just about every business task thrown at it. But there comes a point when a spreadsheet that once made life easier starts creating more work.
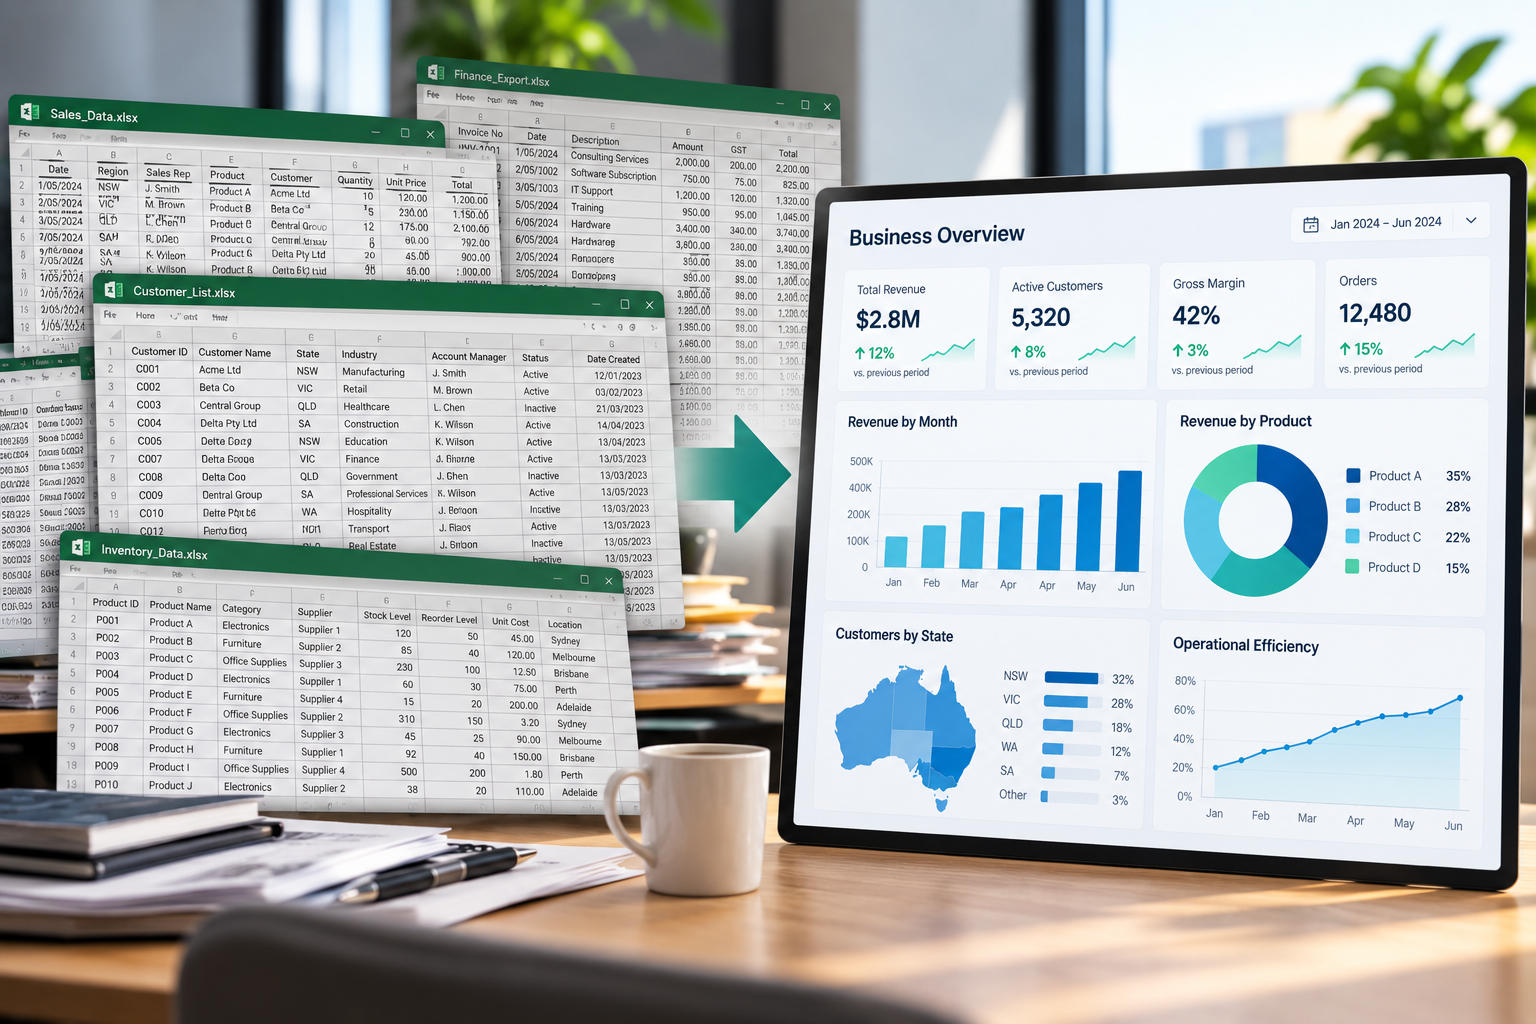
Most organisations are not short of data. The challenge is turning that data into something people can trust, access and use when making decisions.
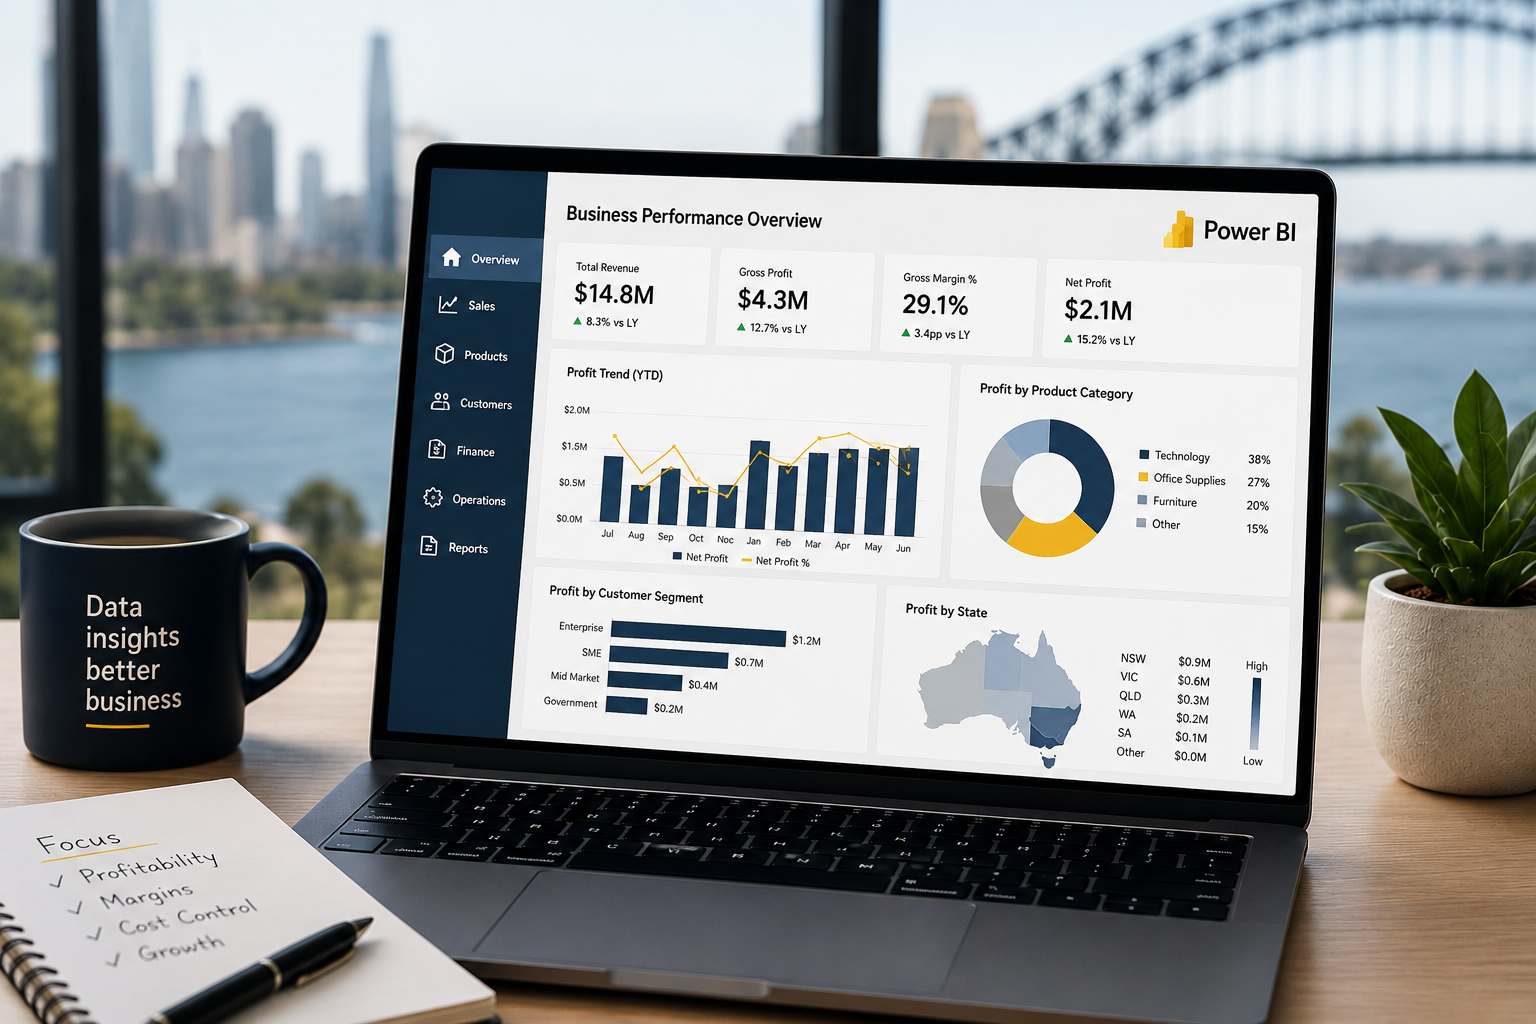
Many Australian businesses face the challenge of turning data into decisions that improve margins, reduce unnecessary costs and uncover opportunities for profitable growth. Microsoft Power BI has become an increasingly valuable part of that process.
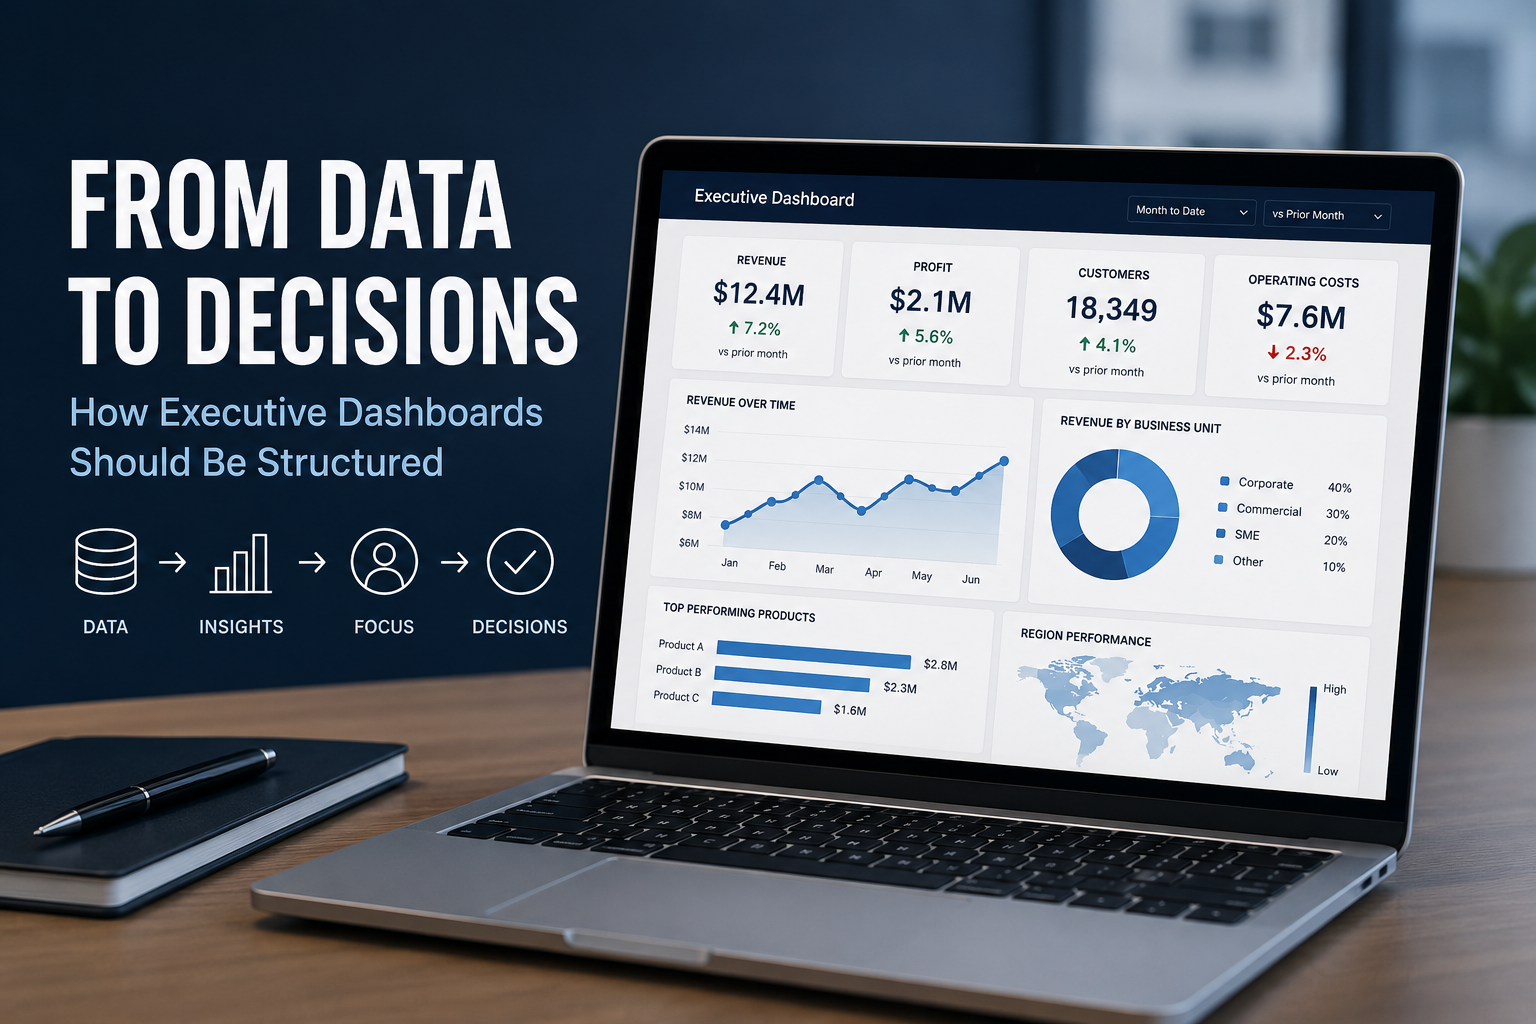
Executives rarely need more data. They need a clearer view of what the data is telling them, what has changed and where their attention is required. That distinction is important when designing an executive dashboard.
A common misconception is that businesses need perfectly organised, enterprise-grade data before they can benefit from AI. While strong data foundations certainly improve outcomes, perfection isn't the goal.
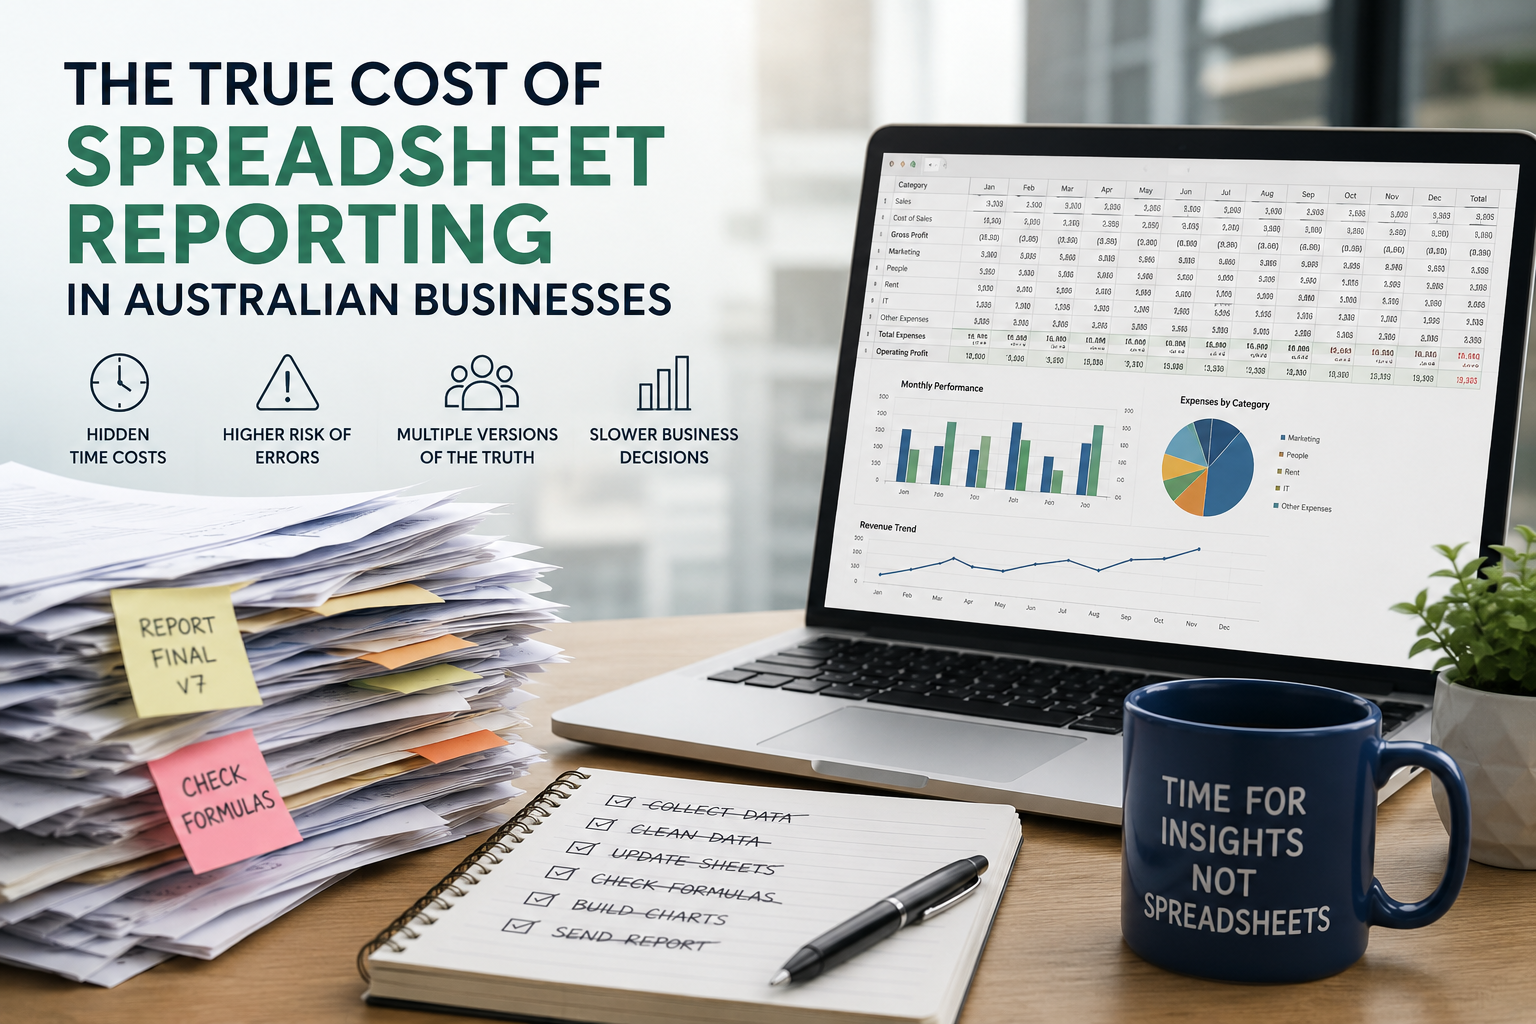
As businesses grow, spreadsheet reporting often becomes an expensive bottleneck that consumes valuable time, increases business risk and limits the ability to make informed decisions.
Learn how to use Power BI parameters to build dynamic, user-friendly dashboards. This guide covers Power Query, field, and what if parameters with practical use cases.
Look back through our old articles using the search function. Key terms to use are “Power BI”, “Tableau”, “Qlik”, “dashboard” and “Visualisation”.
Power BI offers advanced features that can unlock new levels of analysis and interactivity; here are five powerful but often overlooked capabilities.
Read MoreSQL (Structured Query Language) remains one of the most essential tools for data analysts, enabling data manipulation, retrieval, and aggregation to make sense of raw data.
Read MoreBy integrating Power BI with Power Automate, you can optimise your reporting processes, eliminate repetitive tasks, and focus on more strategic decision-making.
Read MoreTableau, one of the leading data visualisation tools, offers powerful capabilities to turn raw data into insights. Get great results by understanding design principles, knowing your audience, and using Tableau’s features effectively.
Read More