Everything you need to know about dashboards and data visualisation software
Data visualisation has been around for years but has come into full force recently with the advent of new software and the open source movement.
What is data visualisation?
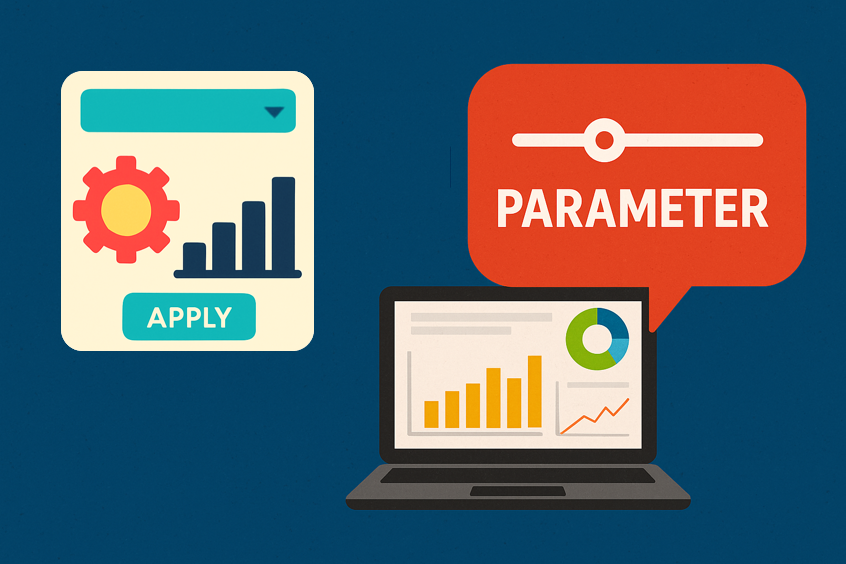
Data visualisation software allows users to create visual representations of data. These visualisations can be in the form of graphs, charts, scatter plots, heat maps, geographic maps or any other type of visual representation. They are often brought together in a dashboard - think of your car dashboard that lays out all your important indicators to scan in an instant.

The dashboard
“All your important indicators scanned in an instant”
The term business intelligence or BI for short is widely used across all industries and in essence, replaces the more traditional roles of reporting.
At White Box, we’re experts in data visualisation and enjoy being agnostic to the tools - this means we focus on what our clients actually want to achieve, rather than forcing a solution we’re accustomed to.
What are the main types of data visualisation software?
It feels like a new “data viz” tool comes out every month but in essence, the heavyweights dominate the market:
Why use data visualisation software?
Most come with a range of easy to use features such as drag-and-drop, out of the box data connections, ways to merge data together (data blending) and the ability to publish the dashboard for others to see and interact with.
The alternative is using the inbuilt reports from each of the platforms you’re using. Although these can tick a few boxes, they are rarely customisable to your needs and will only use the data from that system, so a holistic viewpoint across all of your data points is never within reach.
Excel is the default tool for bringing together multiple data sources and it is a good workaround but you will end up suffering if you think of it as the long term solution. Not least because everyone has some Excel skills and gravitates to putting their own stamp on the data, meaning a single source of truth is hard to achieve.
Do I have to be a data analyst to use data visualisation software?
Though there’s a catch (see below), the short answer is ‘no’. Anyone can use these tools to play with the data, and the vendors are making it easier with every release to integrate data and get going with data analysis.
As mentioned, this comes with a warning. If you don’t know what you’re doing, you can very easily create false insights that are hard to detect. A classic mistake is allowing the tool to aggregate data that is already summarised in its raw state. You’ll get a chart that seems to make sense but unless you diligently audit the raw numbers and compare against your original source, you might never spot it until someone else (most likely the C-level) does.
What data can you use with data visualisation software?
They are very flexible with many out of the box connectors, so often you can get connected to your data with only a few clicks.
This means you can use Excel and Google sheets, databases (SQL Server, MySQL, Snowflake, BigQuery) or ever more advanced APIs.
No doubt your business has a multitude of data sources and technology, all of which is creating more and more disparate data. Data visualisation software is a great way to bring together data points that you never thought you’d be able to see alongside each other on a single display.
Sharing your data visualisation
Once you’ve made your fantastic data visualisation, what better than sharing it?! For most of these tools, sharing a dashboard is relatively easy. However, before you embark on a particular software, keep these points in mind:
Power BI
If you have a free license, you can’t share with others.
You can publish publicly but be aware that anyone on the web can access.
If you have a Pro license, you can share but others will need a Pro license to view.
You can embed this workbook in your website (behind a password if you choose) so that others can view.
Tableau
Tableau Public is a clever way of publishing your workbook for all to see.
If you want to keep it private, you can select “Hide workbook”. You can embed this workbook in your website (behind a password if you choose) so that others can view.
Tableau online is way to share your workbooks with team mates but they will need at least a Tableau viewer license to see them.
Looker Studio
An absolute breeze for sharing and embedding in your website.
Tracking who is using it is tricky. There are posts about using Google Analytics but these are not straightforward.
Qlik
Desktop version is free for personal use, but you can only open documents you've created.
If you have a named license, you can share and consume both desktop and published versions.
How much do they cost?
Prices are often stated in USD, so keep that in mind! They also change regularly, so these are just a guide - read from the source to find the latest pricing.
Get going with one license:
$115 per month
$21 per month
Free
Which data visualisation software is the easiest to tame?
Data visualisation software can have a steep learning curve, especially for those with no prior experience.
However, many providers offer training and support to help users get started, and there are forums to follow and pick up tips and tricks - we have a regular feed of tips across the platforms each week from our LinkedIn page.
The White Box team all have a different viewpoint, which is influenced by their experience, and perhaps their latest success!
Templates or custom build?
We are often asked about out of the box templates and although some of the tools have these, they will often cause more work than building from scratch.
You’ll get more from your dashboard if you customise it to your needs. For many tools, you can go into full creative mode, making changes to color, font, size, and other parameters to completely align with your companies brand guidelines. Creativity of course, should always be about building engagement, not simply used for show.
Looker Studio does offer some nice starter templates.
Static vs interactive dashboards?
Now this might seem like a no-brainer, surely you’d lean to more interactive dashboards, right? But the more options you give people, they can tend to back away. At White Box we push for clarity and restraint, meaning sticking to a small number of high impact metrics and simple relevant interactive options, at least to start with. Many of the “must haves” are often vanity features that serve no purpose, i.e. no actionable decision can be made from them.
It could be that a static report that is distributed can be just as powerful as a fully interactive dashboard. The important thing is to think about your audience and their data savviness.
In most cases a well made interactive dashboard does indeed supersede a static one as you can often add another dimension for those that want to explore, e.g. hovering over data points to see more details, dynamic charts or clicking on different parts of the visualisation to filter data.
What do I do next?
With so many options, how do you make a decision?
Most of these products offer a trial, so why not do a comparison test.
Use the same data / table or database connection and look to build the same, simple dashboard in each.
Get a feel for the user experience in accessing data, creating new fields and building the dashboard.
If that sounds like too much work, then speak to the experts - at White Box we use all of these tools and will give you an honest viewpoint of which one makes most sense for you and your organisation.
We specialise in data visualisation at White Box
We can help illuminate your data so that you can make the right, unbiased decisions for your organisation.
As your partner in data visualisation, we’ll help you to realise the full potential of your data and maximise your business success through advanced and innovative solutions that make all the difference.
Get in touch today for your free data strategy consultation.