Flexible cuts of data
What was wrong
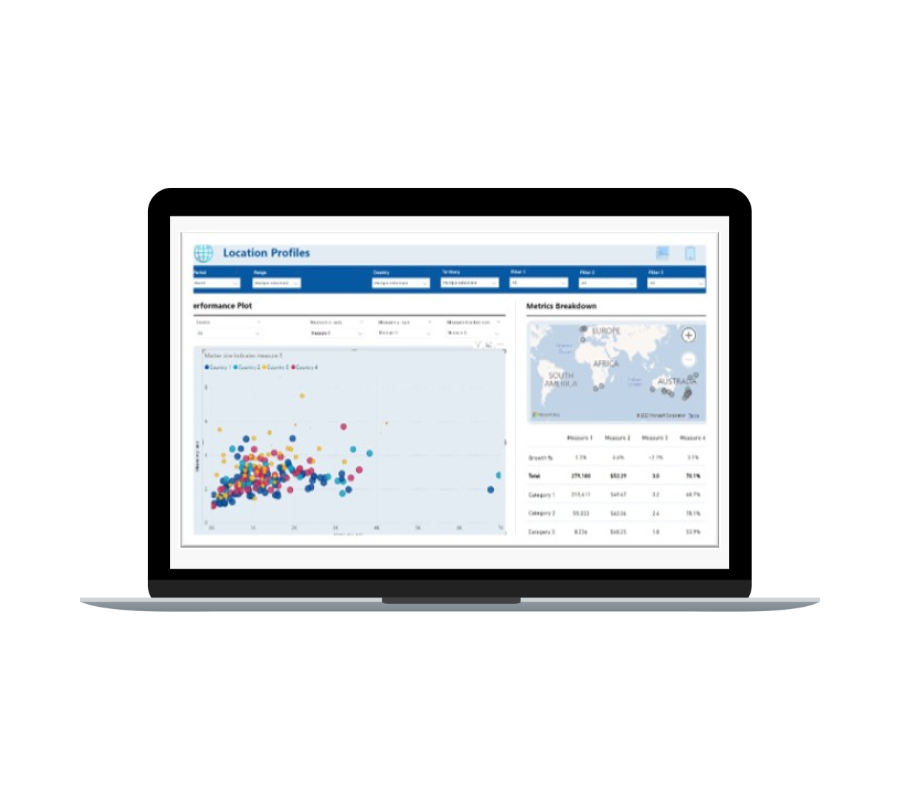
The Regional Australia Institute realised that some of their public-facing dashboards were visually cluttered and difficult for users to navigate, limiting effective communication and public engagement.
What we did
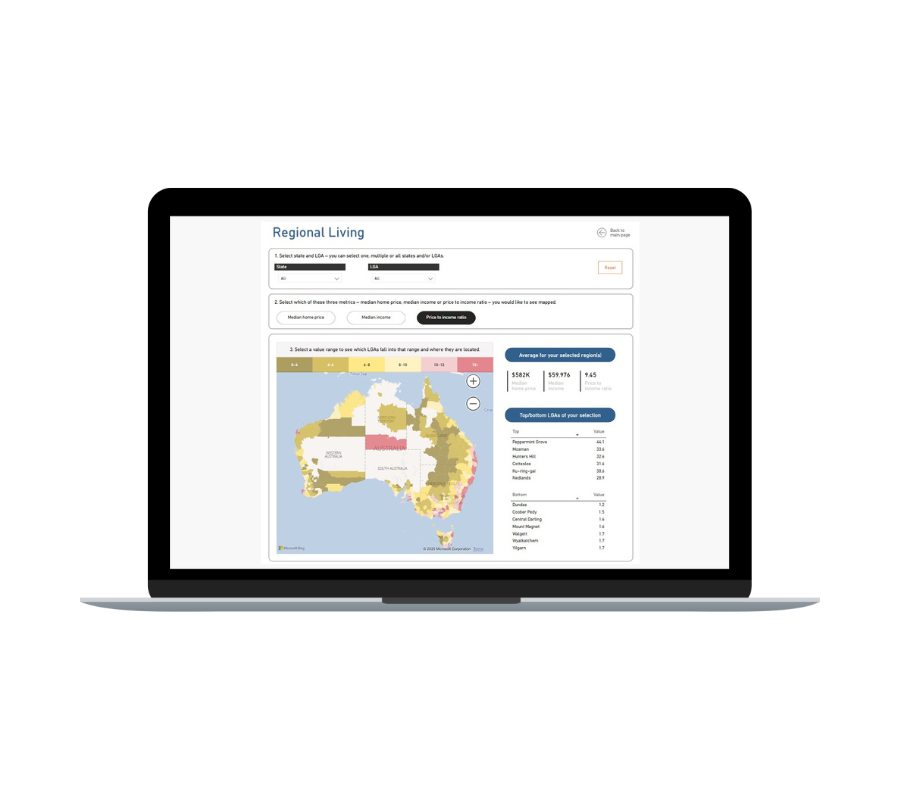
White Box re-imagined their existing dashboard in Power BI, creating a modern, cleaner interface, introducing a map-led layout enhanced with consistent styling, hover notes, and intuitive navigational cues that guided users through diverse information with ease.
Why it mattered
The redesign improved user experience and accessibility, making insights easier to find and understand, and resultantly contributing to the Institute better achieving its mission of informing regional development.

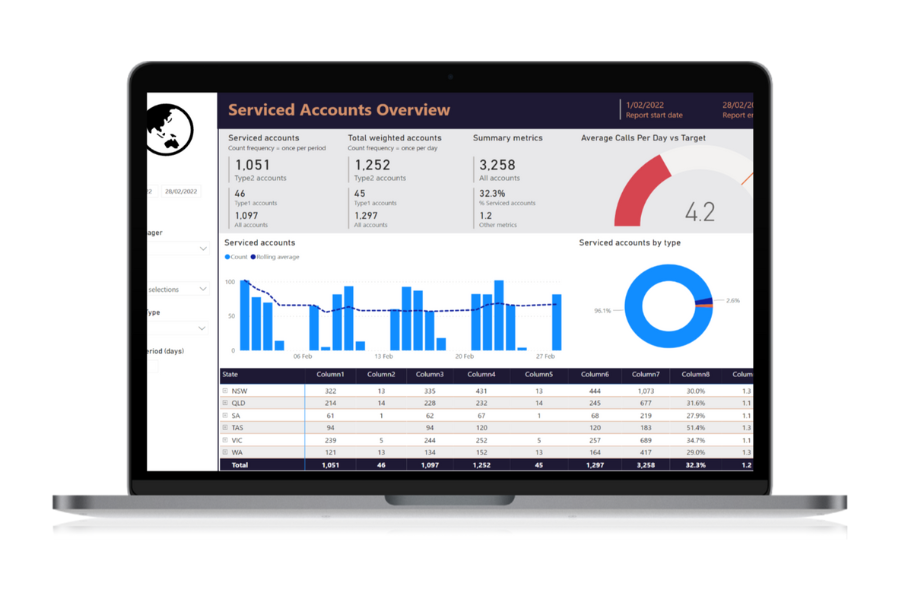
The summary page highlights key questions, answers and trends. These are cherry picked for quick insights and show aggregated or top answers using colour formatting.
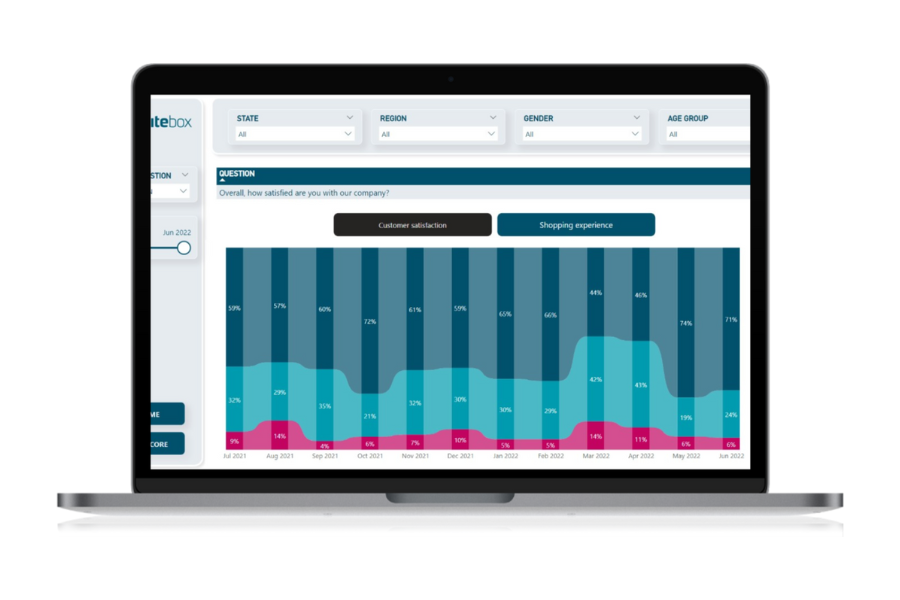
The detail page breaks down every question. There are many different ways to visualise this data but after extensive end user testing, our firm favourite is the ribbon chart (right), which represents the trend and changes on responses to each question.
The example here shows a negative swing in customer sentiment in March and April 2022 - probably due to a client price change.

See more of our customer success stories