
Data consultants
Home Customer Success Data stories FAQ Contact us
HomeCustomer SuccessData storiesFAQContact us
Data consultants

Read our regular blog on all things data

At White Box, we’re passionate about data analysis & visualisation and we like to showcase this through our Data Stories.

Our blog posts cover diverse topics but all have data analysis and visualisation as the backbone to the thoughts and insights we uncover.

Visualisation
Getting Your Data AI-Ready (Without Starting From Scratch)
July 22, 2026
Getting Your Data AI-Ready (Without Starting From Scratch)
July 22, 2026
July 22, 2026
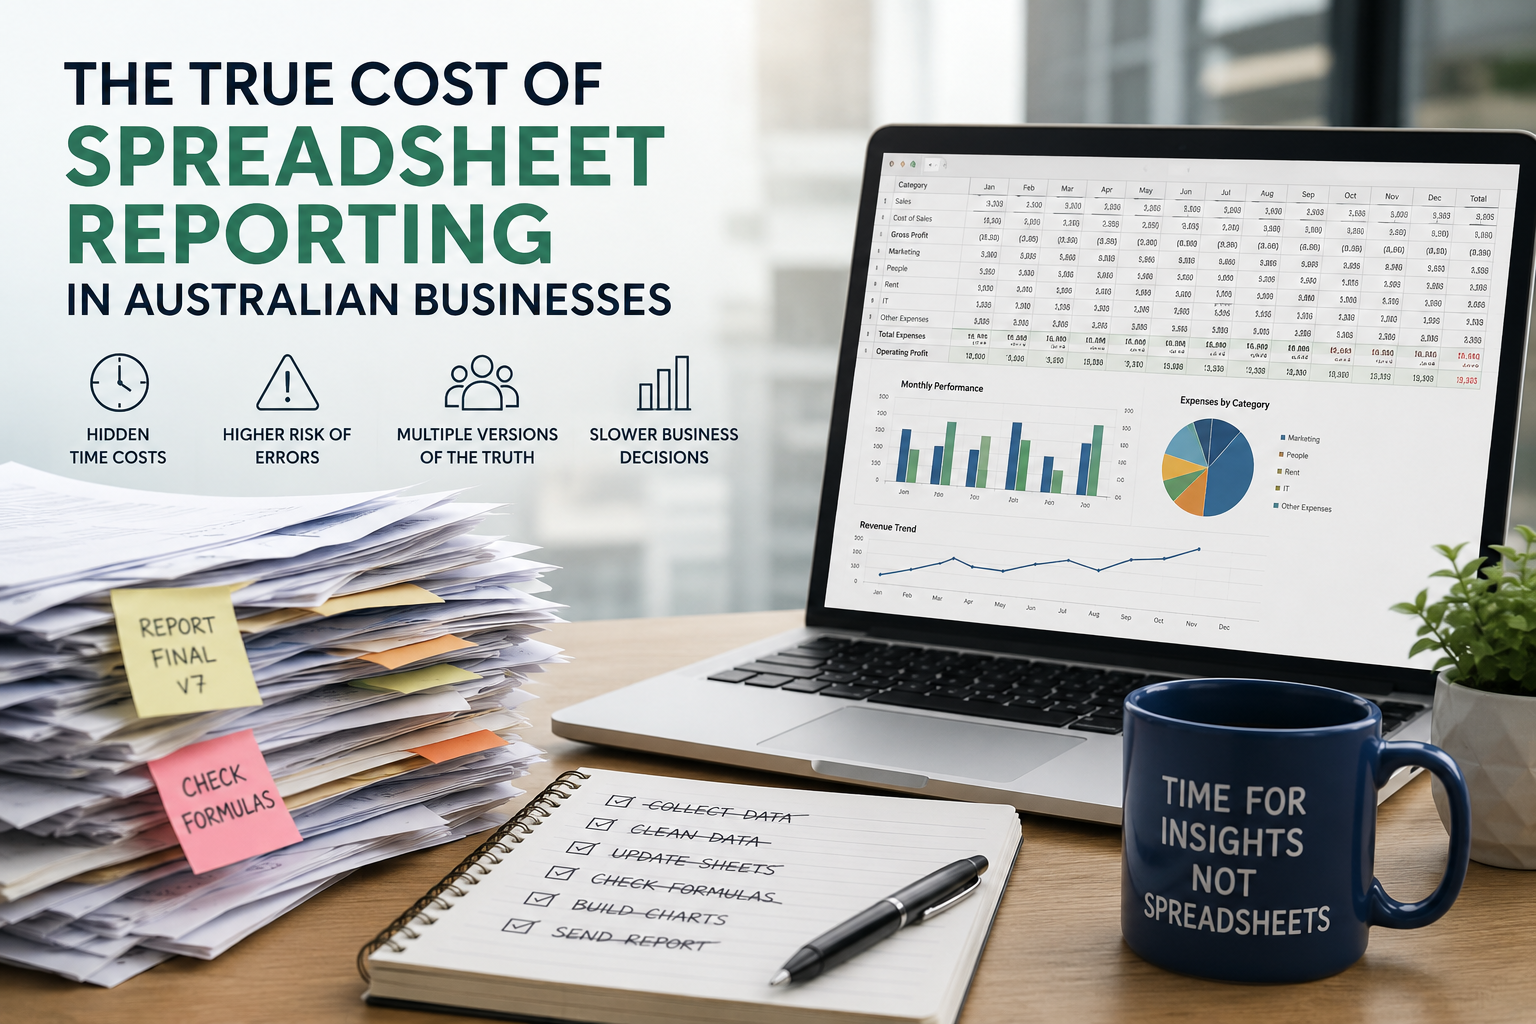
The True Cost of Spreadsheet Reporting in Australian Businesses
July 3, 2026
The True Cost of Spreadsheet Reporting in Australian Businesses
July 3, 2026
July 3, 2026
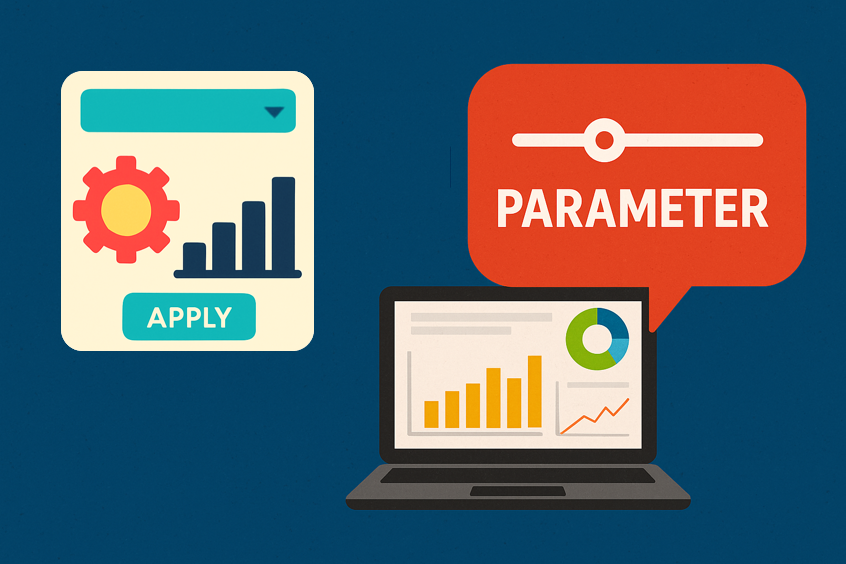
Unlock Dynamic Dashboards with Power BI Parameters
July 28, 2025
Unlock Dynamic Dashboards with Power BI Parameters
July 28, 2025
July 28, 2025
Power BI vs Tableau: Which Tool is Right for Your Business?
July 14, 2025
Power BI vs Tableau: Which Tool is Right for Your Business?
July 14, 2025
July 14, 2025
Storytelling with Data: Turning Numbers into Narratives
June 17, 2025
Storytelling with Data: Turning Numbers into Narratives
June 17, 2025
June 17, 2025
AWS vs. Azure vs. Google Cloud: Which Cloud Platform is Best for Analytics?
June 10, 2025
AWS vs. Azure vs. Google Cloud: Which Cloud Platform is Best for Analytics?
June 10, 2025
June 10, 2025
10 Common Power BI Mistakes and How to Avoid Them
May 8, 2025
10 Common Power BI Mistakes and How to Avoid Them
May 8, 2025
May 8, 2025
Power BI Paginated Reports vs. Standard Reports: When to Use Each
April 30, 2025
Power BI Paginated Reports vs. Standard Reports: When to Use Each
April 30, 2025
April 30, 2025

Search

Look back through our old articles using the search function. Key terms to use are “Power BI”, “Tableau”, “Qlik”, “dashboard” and “Visualisation”.

No results found

Our latest posts

How to use interactive image dashboards in Power BI to gain deep business insights

We have successfully applied image interaction into Power BI to enable our client to gather the insights they required in a simple and efficient visual format.

Read More
Learn/New Features, VisualiseLouis KeatingMarch 30, 2022powerbi, interactive, insights
How Alibaba uses Data Analytics and Insights to improve every Customer’s Shopping Experience

Imagine if you could harness the predictive analytical power of a company like Amazon to determine what products and services your customers were likely to buy, based solely on data collected from the previous behaviour.

Read More
CommentaryLouis KeatingMarch 23, 2022predictive analysis, data science
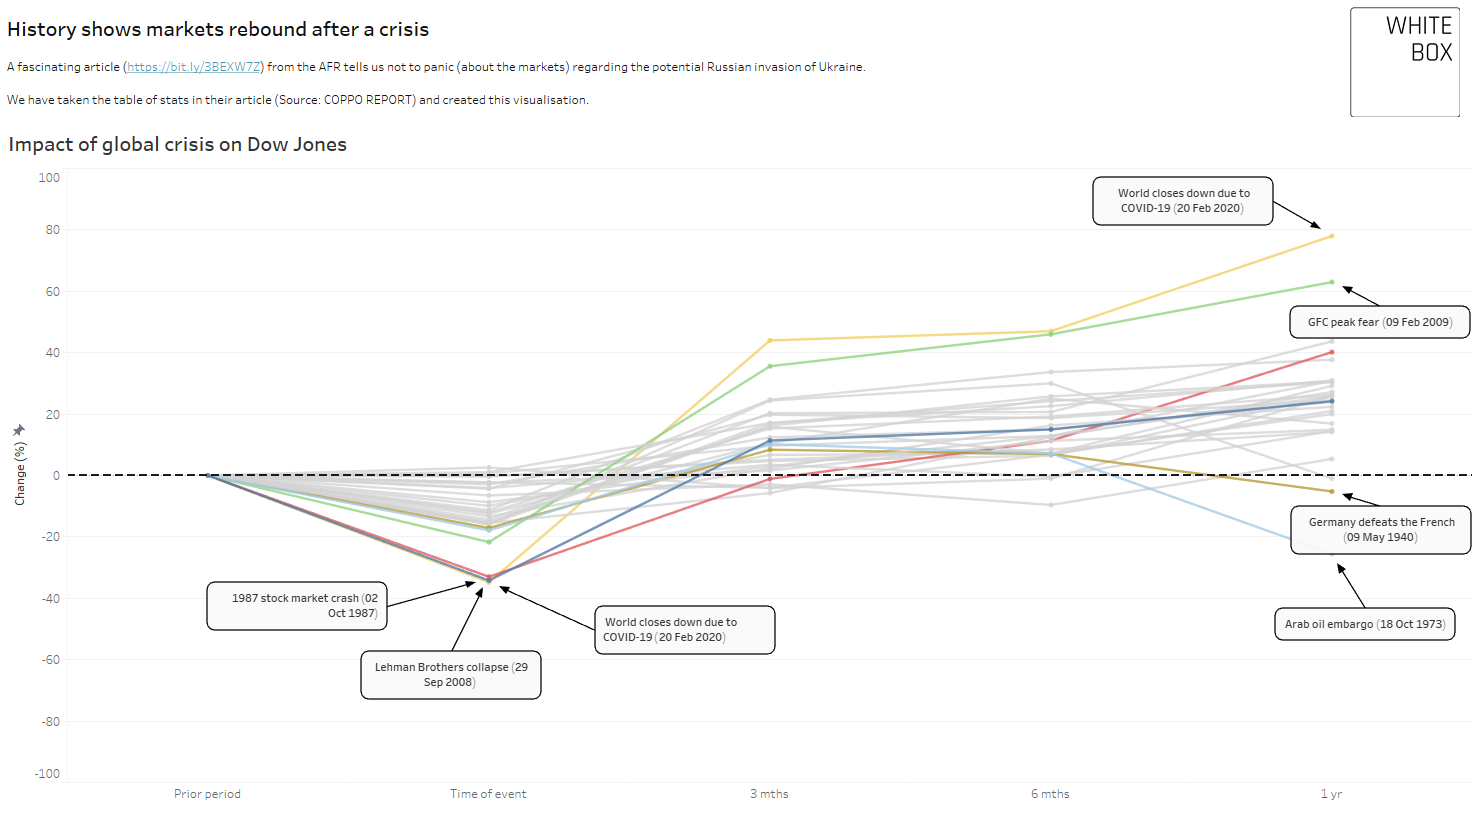
History shows markets rebound after a crisis

One of our core competencies at White Box is being able to turn raw data into something more digestible. So after reading an article on the AFR, we set about doing just that.

Read More
VisualiseLouis KeatingFebruary 22, 2022Tableau
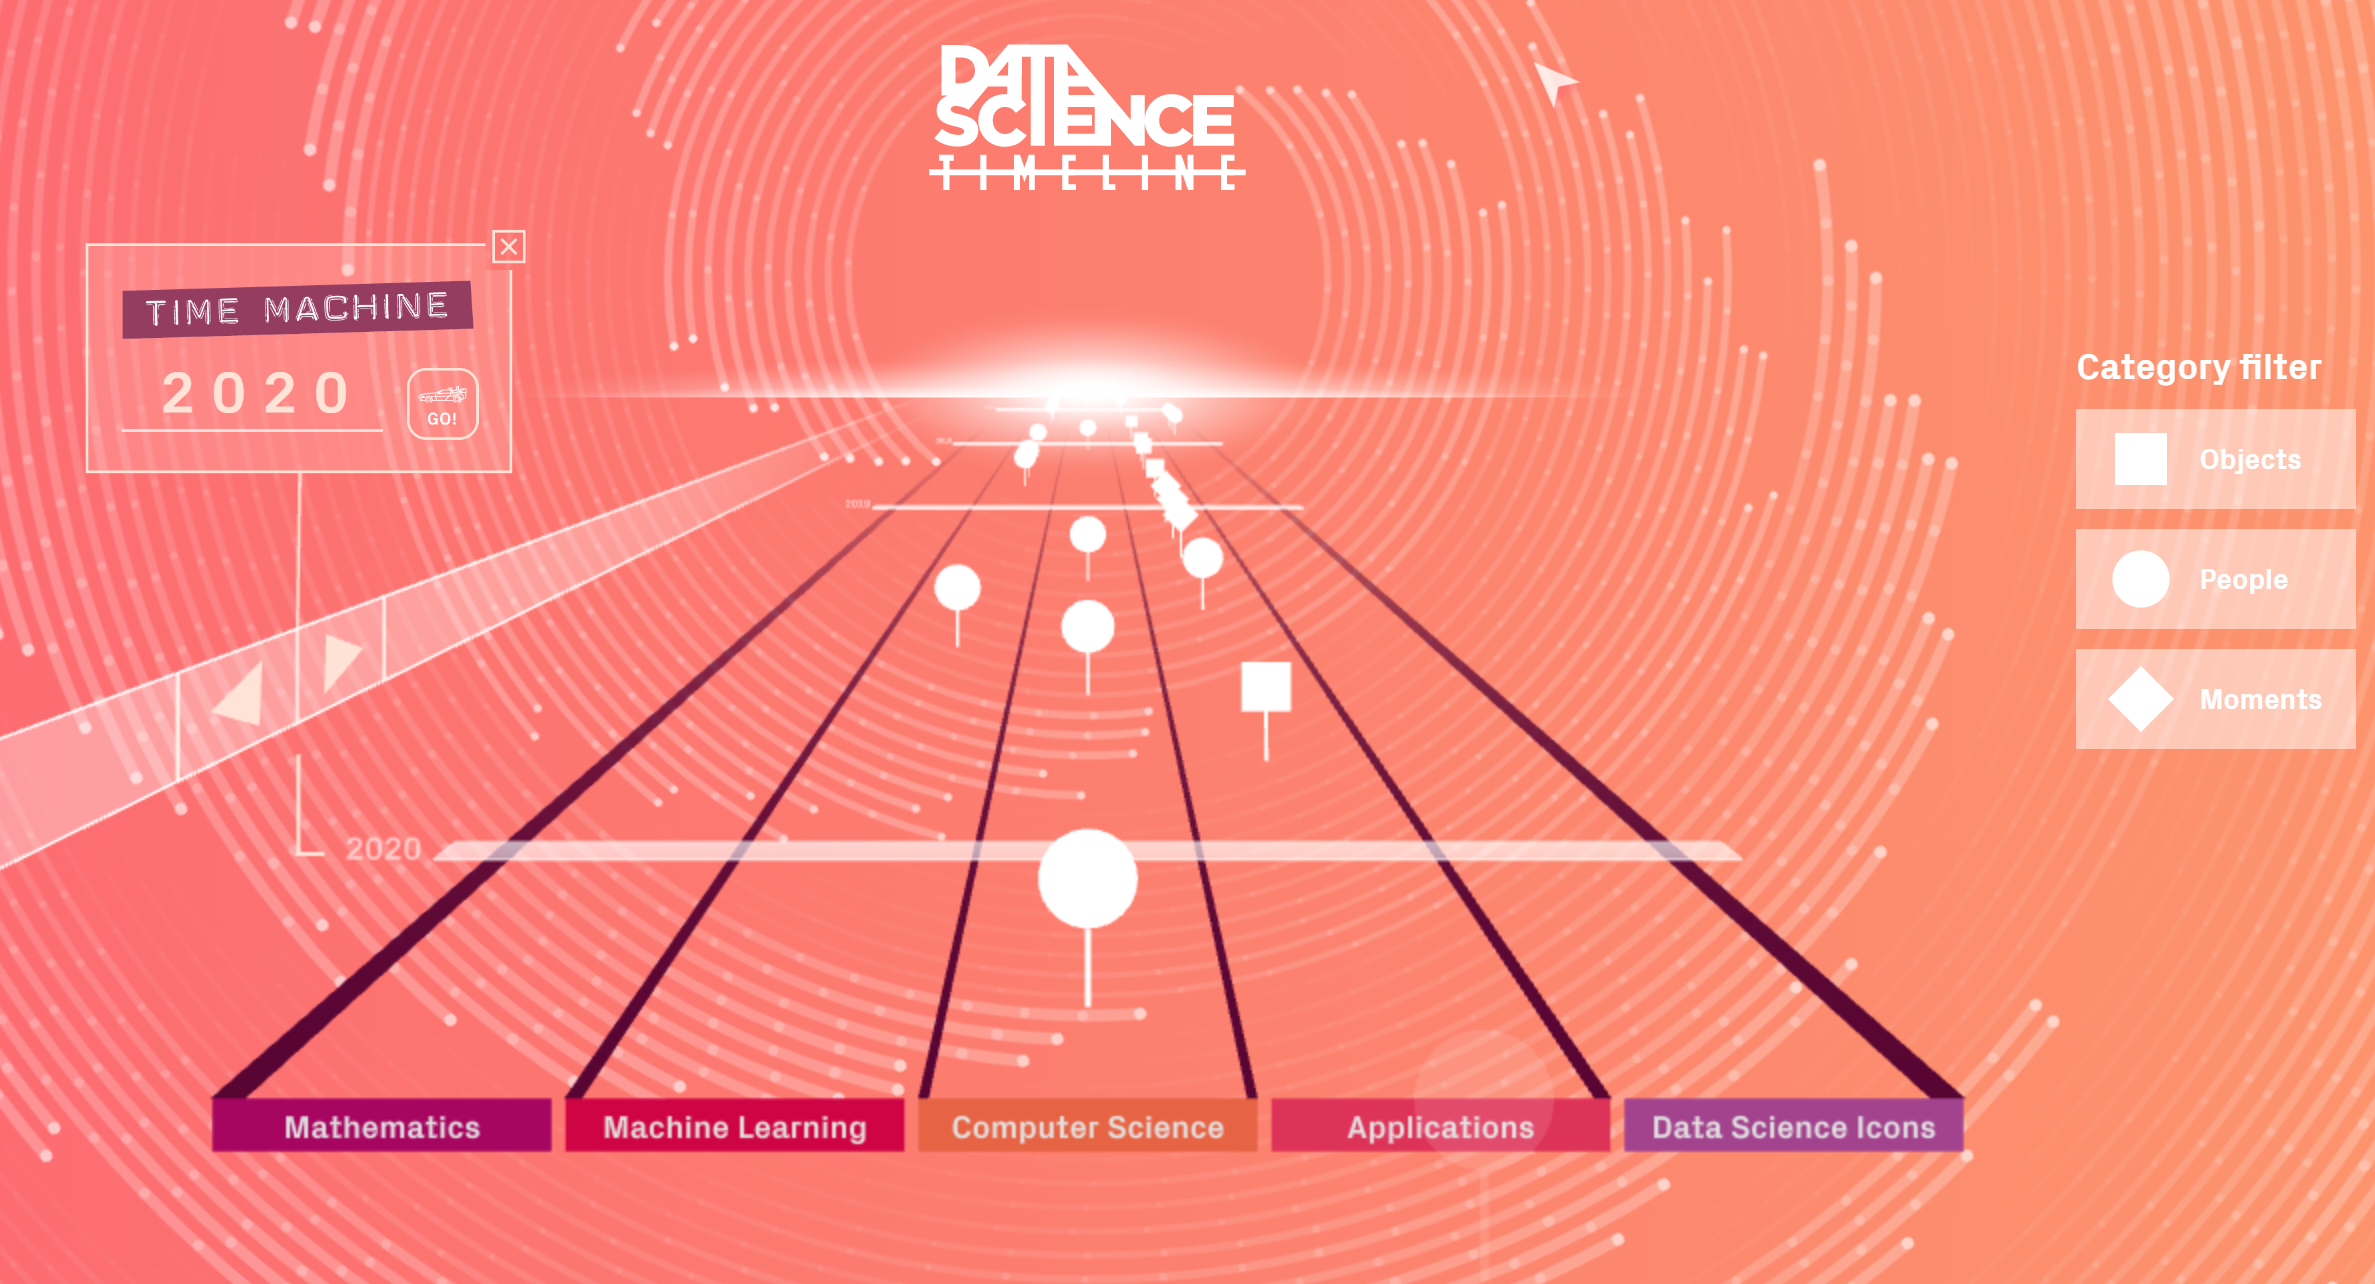
The History of Data Science

This is a fun way to explore the centuries of history behind data science.

Brought together by data iku, it explores the many people and moments in history that have defined this vast area of expertise!

From the early beginnings of Bayes’ theorem, right up to the more recent modelling that helped Pfizer-BioNTech develop the Covid-19 vaccine.

Read More
Visualise, CommentaryLouis KeatingJanuary 18, 2022data science
India sets out to reduce coal production

Given India’s reliance on coal - 70% of their energy comes from it - our data scientist Sai Diwakar took a look at some of the publicly available data to see how India is tracking and what’s involved for them to reduce their reliance on coal power.

Read More
VisualiseLouis KeatingJanuary 11, 2022Tableau, visualising data, India, Coal
Newer Older
 
White Box Analytics Pty Limited
478 George Street,
Sydney, NSW, 2000,
Australia
+61415775733 team@whiteboxanalytics.com.au
Hours
Mon 9am - 5pm
Tue 9am - 5pm
Wed 9am - 5pm
Thu 9am - 5pm
Fri 9am - 5pm
Sydney data analytics companyFAQTerms of servicePrivacy policyContact us

ABN: 64622954054 - Contact: team@whiteboxanalytics.com.au

Location: 10 Carrington Street, Sydney NSW 2000 - Phone: 0451767255