Human Resources Dashboard
Overview
Data quality can be just as important as the data itself.
Without well established frameworks for entering, capturing and storing data, any data analysis will be extremely time consuming, lead to incorrect insights and often cause arguments on who has the correct interpretation in meetings.
The problem many leaders face today is that despite knowing this, they still plague their operation with the use of legacy data systems as a result of one of:
Inertia – it has been broken for so long, that people just deal with the inefficiencies.
Skill and time – the time and expertise required to make a change just isn’t available.
Budget – the thought of data projects screams dollar signs which just can’t be justified.
If you care about the use of data, these problems will ring true to some degree, but it’s what you do about it from here that really matters.
This case study discusses the solution we built for a client with these problems, and how their willingness to grow and develop has taken them to the forefront of data strategy in their industry.
The problem
Our client owns and manages multiple offices across Australia, of which all update spreadsheets on a daily basis.
As a result, our client had hundreds of high quality data sources, all in slightly different formats, and different locations, rendering it siloed, and relatively useless in its ability to quickly produce insights into their businesses performance.
The client not only wanted to streamline data entry, but use their valuable asset to inform their customers, generate interesting insights about their industry, drive communications efforts and save hundreds of hours of work in the process.
The solution
Microsoft Lists was identified as the tool that would enable this in the most cost effective way plus automatically connect to Power BI for their reporting requirements.
This is a free solution offered within the Microsoft suite, made for use within SharePoint, where users can work collaboratively on data input. It offers flexibility in terms of configuring:
Rules for data input to alleviate the risk of spelling or calculation errors.
Creating custom views for specific users in different locations.
Including/excluding certain data points based off key information e.g. newest and oldest data.
It has a similar feel to Excel, so the new user experience was a gentle evolution.
Alongside this solution, we unlocked the historical data of our client which resided in Excel spreadsheets, creating a standardised, robust data table which we connected to the MS Lists output.
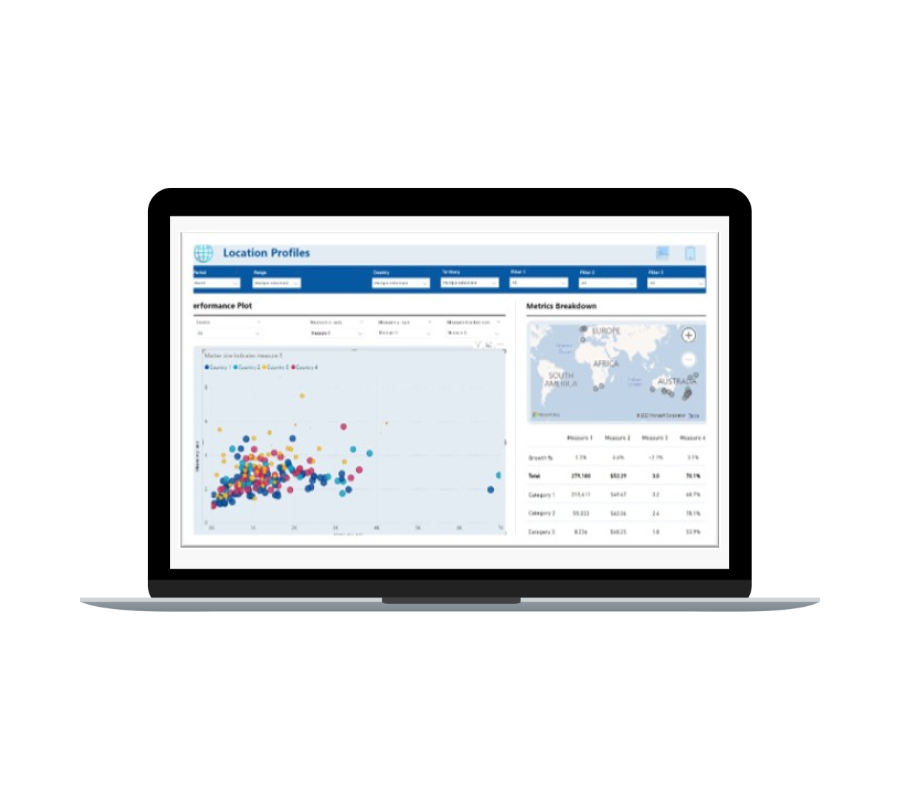
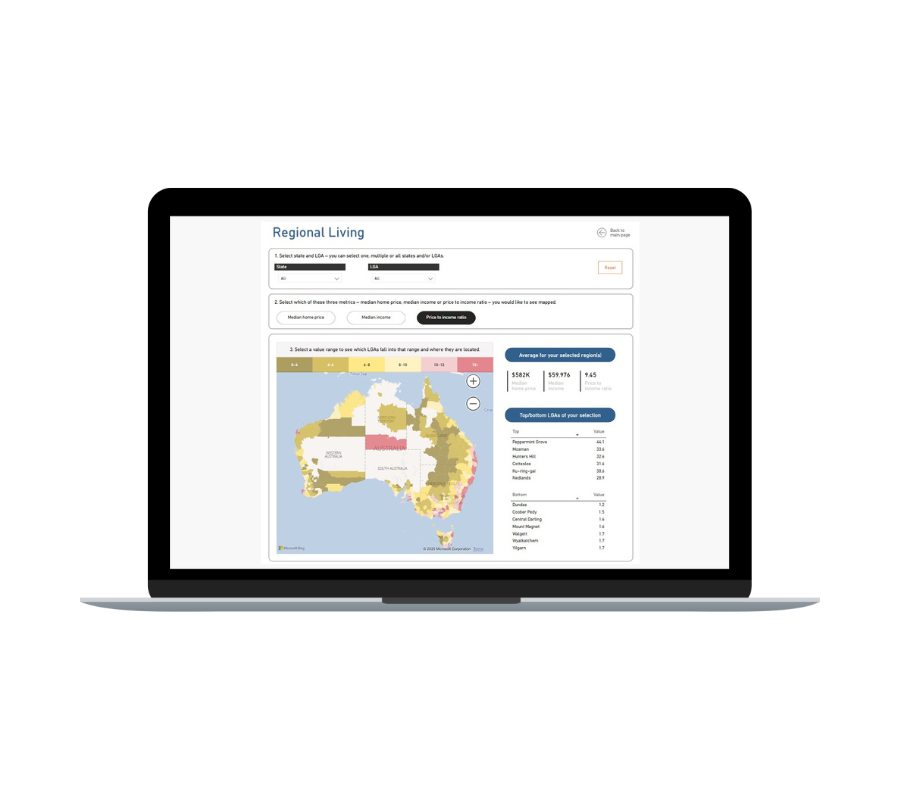
This lead to the final component of our solution, visualising the data in Power BI. This component allowed our client to visualise past trends, offer comparison metrics across offices, country locations, and other company specific assets, all whilst enabling their data to be a driving factor in future revenue generation.

The results
By standardising the data inputting process, our client was able to reduce the number of users inputting data from over 10 to 2 people. The whole process is automated, so no waiting for data to be loaded or cleaned, its available straight away.
They were able to use the dashboards to generate untapped insights which they could use to drive social content, and reports to inform their key stakeholders of progress.
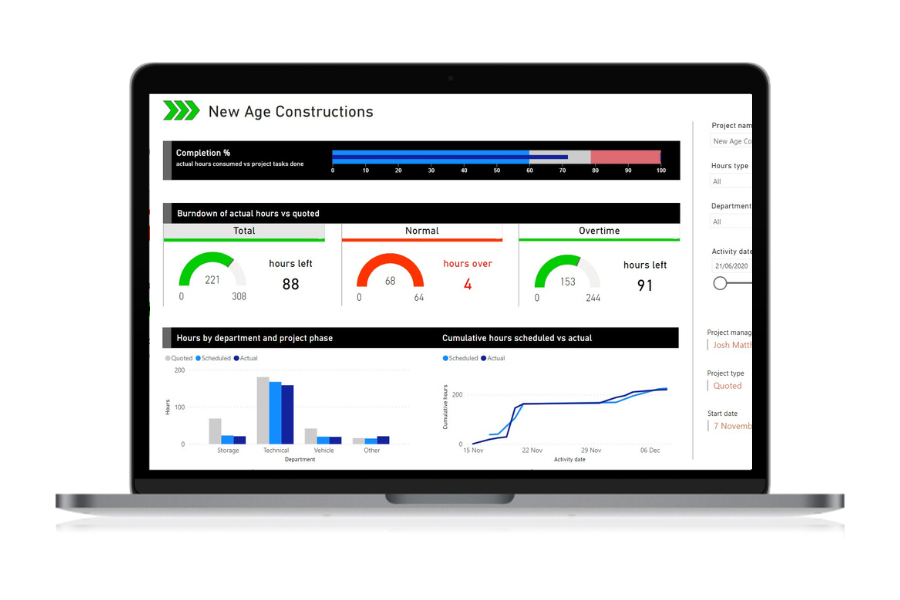
We have produced a likewise version of a Human Resource Dashboard which utilises MS Lists as its key data source to protect client confidentiality.
The below dashboard is interactive, so feel free to click on charts and filters to see new cuts of the data.
Want to know how your business could implement a similar solution? Contact us now to find out more.
Read more customer success stories