Are you seeing the value in your Tableau data?

We can shine a light


HERO_2.jpg
 

White Box is your partner in Tableau data visualisation


The problem

You want your masses of data to translate into clear answers at your fingertips through Tableau, but it takes time, energy and know-how. At least one of those is proving hard to come by.
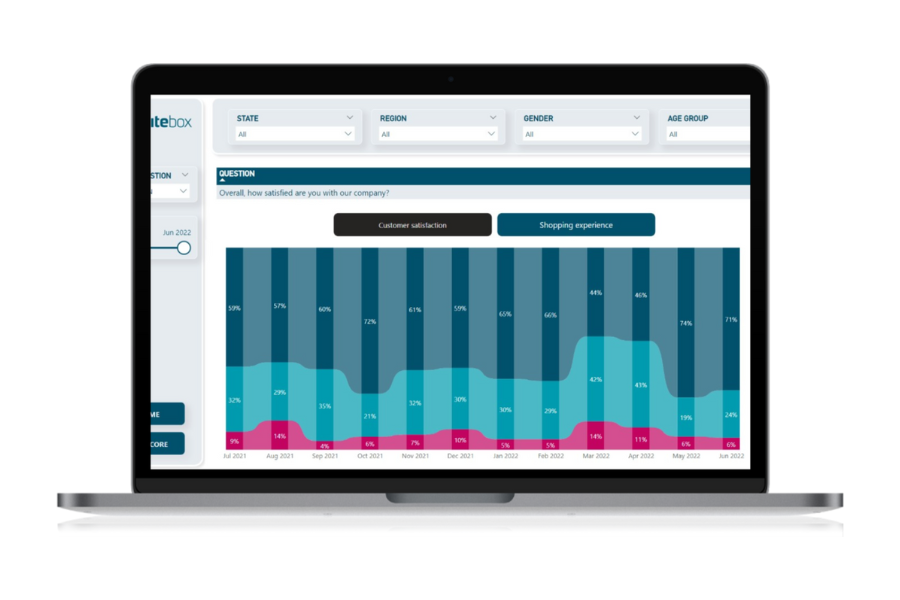
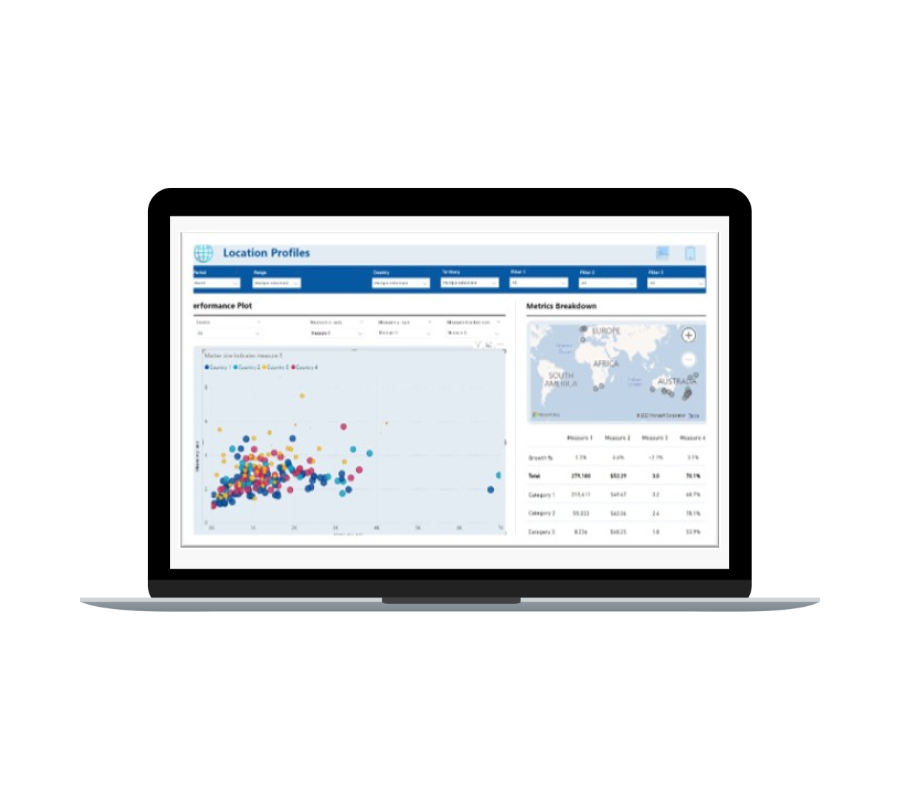
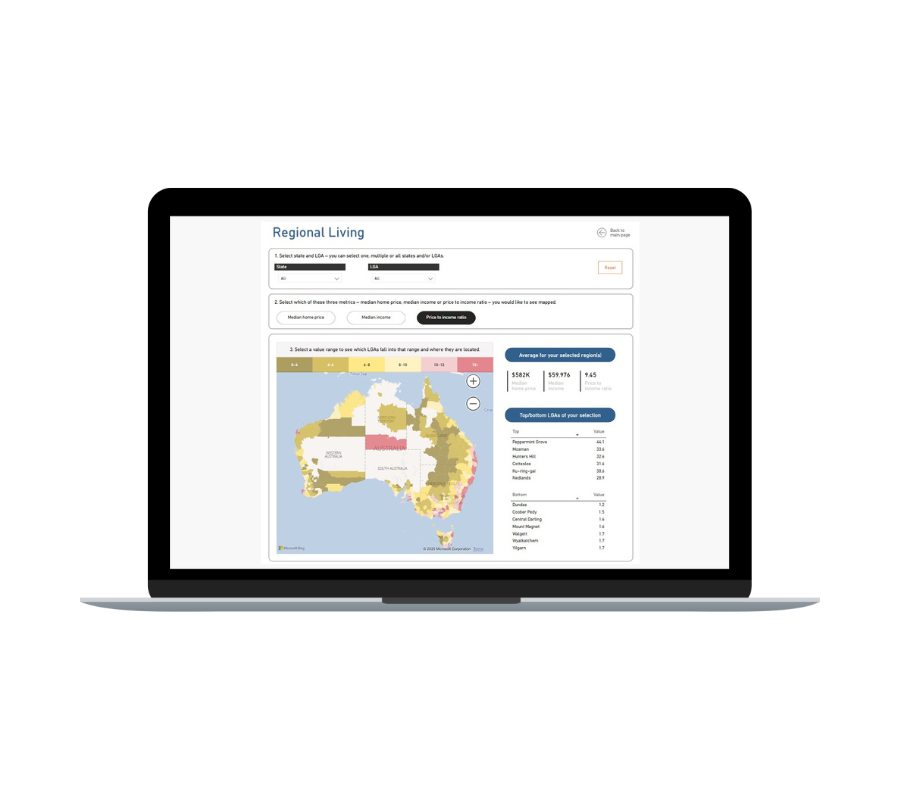
The process

We’ve guided a multitude of companies like yours using our proven FIVE STEP PROCESS that places a premium on connecting to your vision and needs in Tableau. Transparent, efficient and effective.

The prize

Our clients feel liberated, then empowered, on top of their data asset and making Tableau work for them. They are able to focus their attention on lighting the way forward instead of grappling with the past.


Bring your Tableau data to life

Data visualisation turns your data asset into the accessible and impactful format that you need in order to make fast effective decisions every day. Empower your team with interactive real-time Tableau dashboards, while putting an end to emails laden with attachments.

With the guidance of White Box you’ll see your data like never before, gaining insights that will drive success with your stakeholders, investors, and customers.


 We can kickstart your journey

While you may have taken the step of committing to Tableau, getting on with it can be daunting. Together with White Box as trusted advisor, we can launch that rocket so you gain momentum and start getting value from your data-driven reports sooner than you think.


Learn about our best practice data analytics and visualisation methodology.


Featured Tableau data stories

At White Box, we’re passionate about data analysis & visualisation and we like to showcase this through our Data Stories.

Our blog posts cover diverse topics but all have data analysis and visualisation as the backbone to the thoughts and insights we uncover.


Read our customer success stories

At White Box we have helped a multitude of clients make better use of their data - from impactful dashboards to
machine learning algorithms that predict churn.

These showcase our expertise in Power BI, Tableau, Qlik and Looker Studio as well as our deep understanding of SQL, R and Python.


Get in touch

Find us


Sign up to our data stories